|
invent!ory ULTRA
2013 Help |
|
|
Reports |
|
|
You can view/print over 100 reports of your current data by clicking Main Menu | Reports | Current Database.
For Archived data, choose Main
Menu | Reports | Archive Database. |
|
|
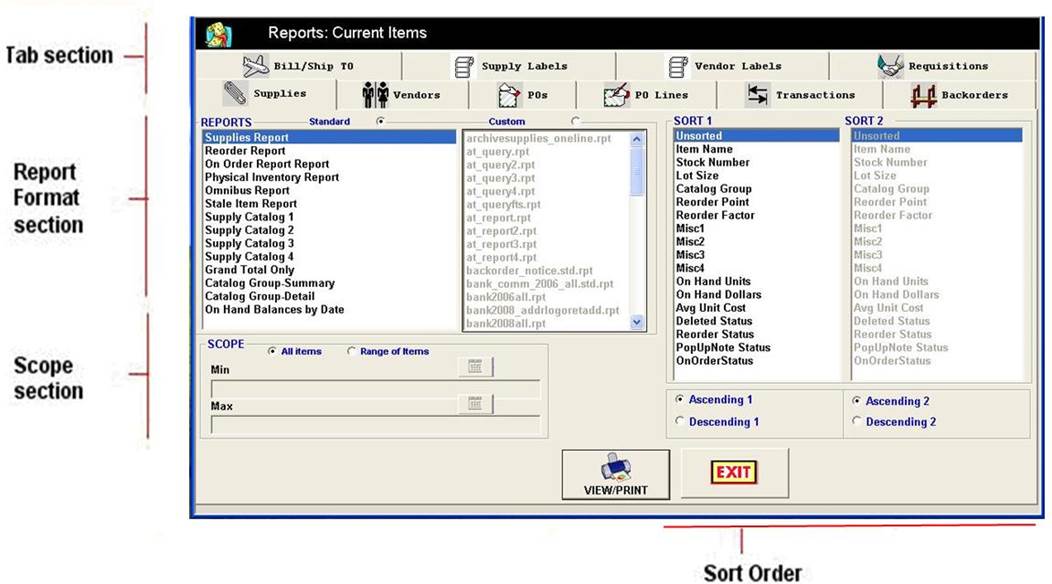
Universal Report Window All reports use the same general approach to select the desired class of reports from
the Tab Section at the top
of the screen . The default tab is “Supplies” (below) but just click on
whichever tab you desire to see the reports it offers.
|
|
|
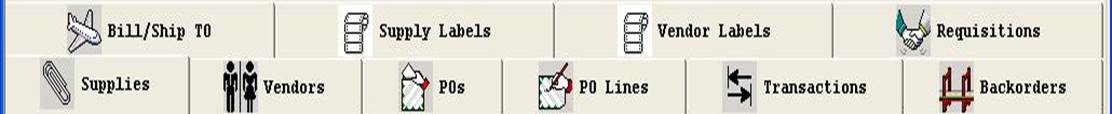
Tab Section These ten tabs cover the classes of data you may view/print as
reports. Each tab offers a number of report options including prefiltered
reports that each perform a special task. Reorder reports, Usage-By-Department
reports, Today’s transactions reports, Stale Item reports are examples of
these prefiltered reports.
|
|
|
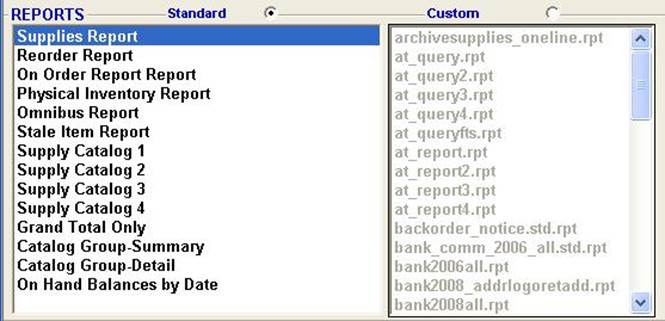
Report Format Section When you click on a new tab, a new set of report options appear in the Report Format window (below).
Here are the Standard reports
available under the Supplies tab.
Standard reports are preprogrammed by KSI to achieve a certain task. Note: Certain custom reports are
available in the right-hand window. To select a custom report, click the “Custom”
option button at the top. If “standard” option button is clicked, the custom
reports are greyed out. |
|
|
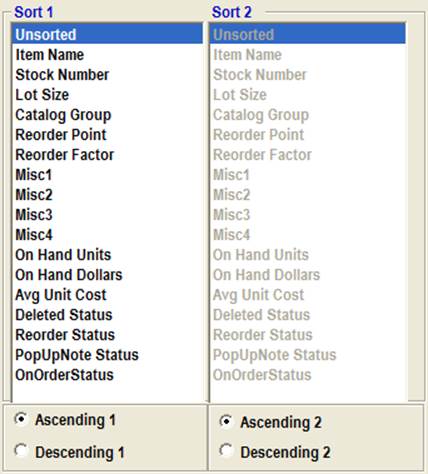
There are two levels of sorting
available for a report - Sort 1
and Sort 2. Sort 1 is what is call the Primary Sort key, which is also the
key which is used for specifying a Scope
min/max range for "filtering" a subset of records. Sort 2 is a subsort within the Primary Sort Key. For example, if you set Sort 1
= Catalog Group, then you might want to set
Sort 2 = Item Name so that the each catalog group in the report is shown in
alphabetical order. Ascending/Descending options buttons. These option buttons set the
listing order for each sort parameter. For example, you may want the
report records to appear in Ascending Catalog Group number order but in Descending Avg Unit Cost
order to show the most expensive items first within each catalog group. Note: In certain report formats, Sort 1 may be
preset and "greyed out" so you cannot change it. This has to do with
the mechanics of generating certain report such as the Usage By Dept report,
in which the default sort 1 field must be "Department". |
|
|
Scope Section
Range of Items Option button. If you want a subset of records, then click
the "Range of Items"
option button in the Scope section. The range will be chosen
from the field selected by Sort 1. Lot Size is the selected Sort1 field. Notice that the Min and Max text boxes will "ungrey" and allow you to enter the
range values. The Supply Report will consist of all records with EACH as its Lot Size.
Note that the Sort 1 variable "AVG UNIT
COST" is shown next the Min
and Max labels in the Scope
section to remind you that you are filtering on Sort 1. Note: If we wanted all items with $0 Avg Cost,
then we set both the Min and Max values to 0. |
|
|
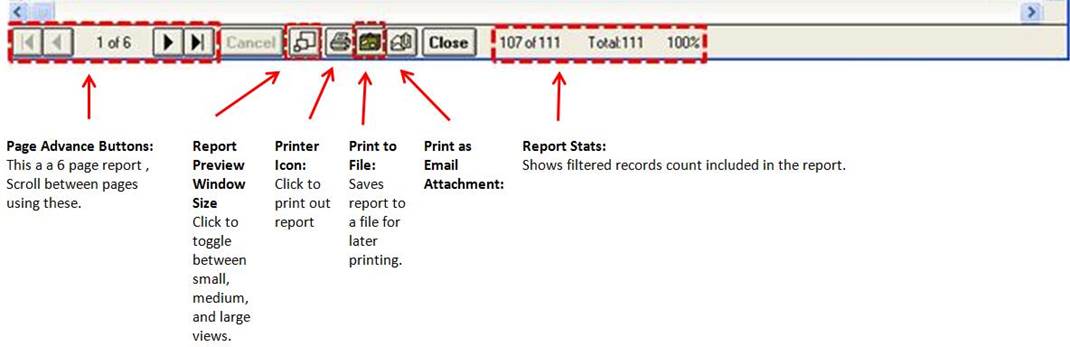
Print Preview Window The Print Preview window lets you see the report on the screen
EXACTLY as it will appear when printed. It also lets you send the
report to a file for later printing or as an email attachment (you must save in Rich Text
format in the email dialogue) from the Print Preview window for the email attachment. Here (below), we have printed
out Omnibus Report filtered on the
min/max range of $0 to $100 dollars for Avg
Unit Cost example from the
previous page.
|
|
|
|
|
|
Copyright 2017, Koehler Software, Inc. |
|